Three different ways to do parameter sampling
This code snipped shows how to use LensTools to perform cosmological parameter sampling with three diffenent methods: direct evaluation of the likelihood, Fisher Matrix and MCMC
from lenstools.statistics.ensemble import Series,Ensemble
from lenstools.statistics.constraints import Emulator
from lenstools.statistics.contours import ContourPlot

import numpy as np
import matplotlib.pyplot as plt


def lt_sample(emulator,test_data,covariance,p_value=0.68):

        #Check that the data types are correct
        assert isinstance(emulator,Emulator)
        assert isinstance(test_data,Series)
        assert isinstance(covariance,Ensemble)

        #Plot setup
        fig,ax = plt.subplots(figsize=(8,8))


        #Map the likelihood in the OmegaM-sigma8 plane, fix w to -1
        p = Ensemble.meshgrid({
                "Om":np.linspace(0.2,0.5,50),
                "sigma8":np.linspace(0.6,0.9,50)
        })

        p["w"] = -1.

        #Compute the chi squared scores of the test data on a variety of parameter points
        scores = emulator.score(p,test_data,covariance,correct=1000,method="chi2")
        scores["likelihood"] = np.exp(-0.5*scores[emulator.feature_names[0]])

        contour = ContourPlot.from_scores(scores,parameters=["Om","sigma8"],
                feature_names=["likelihood"],
                plot_labels=[r"$\Omega_m$",
                r"$\sigma_8$"],fig=fig,ax=ax)

        contour.getLikelihoodValues([p_value],precision=0.01)
        contour.plotContours(colors=["red"])
        contour.labels()

        #Approximate the emulator linearly around the maximum (Fisher matrix)
        fisher = emulator.approximate_linear(center=(0.26,-1.,0.8))

        #Consider (OmegaM,sigma8) only
        fisher.pop(("parameters","w"))
        fisher = fisher.iloc[[0,1,3]]

        #Fisher confidence ellipse
        ellipse = fisher.confidence_ellipse(covariance,
                correct=1000,
                observed_feature=test_data,
                parameters=["Om","sigma8"],
                p_value=p_value,
                fill=False,
                edgecolor="blue")

        ax.add_artist(ellipse)

        #MCMC sampling of (OmegaM,sigma8)
        samples = emulator.sample_posterior(test_data,
                features_covariance=covariance,
                correct=1000,
                pslice={"w":-1},
                sample="emcee")[emulator.feature_names[0]]

        ax.scatter(samples["Om"],samples["sigma8"],marker=".",color="black",s=1)
        ax.set_xlim(0.2,0.5)
        ax.set_ylim(0.6,0.9)

        #Save the figure
        fig.tight_layout()
        fig.savefig("parameter_sampling.png")
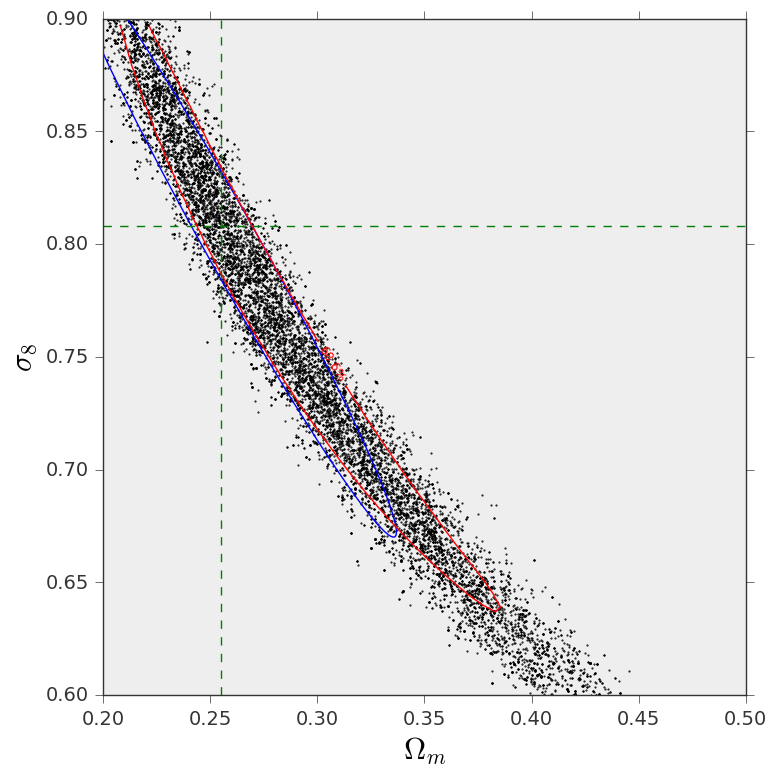
And this is the resulting figure: