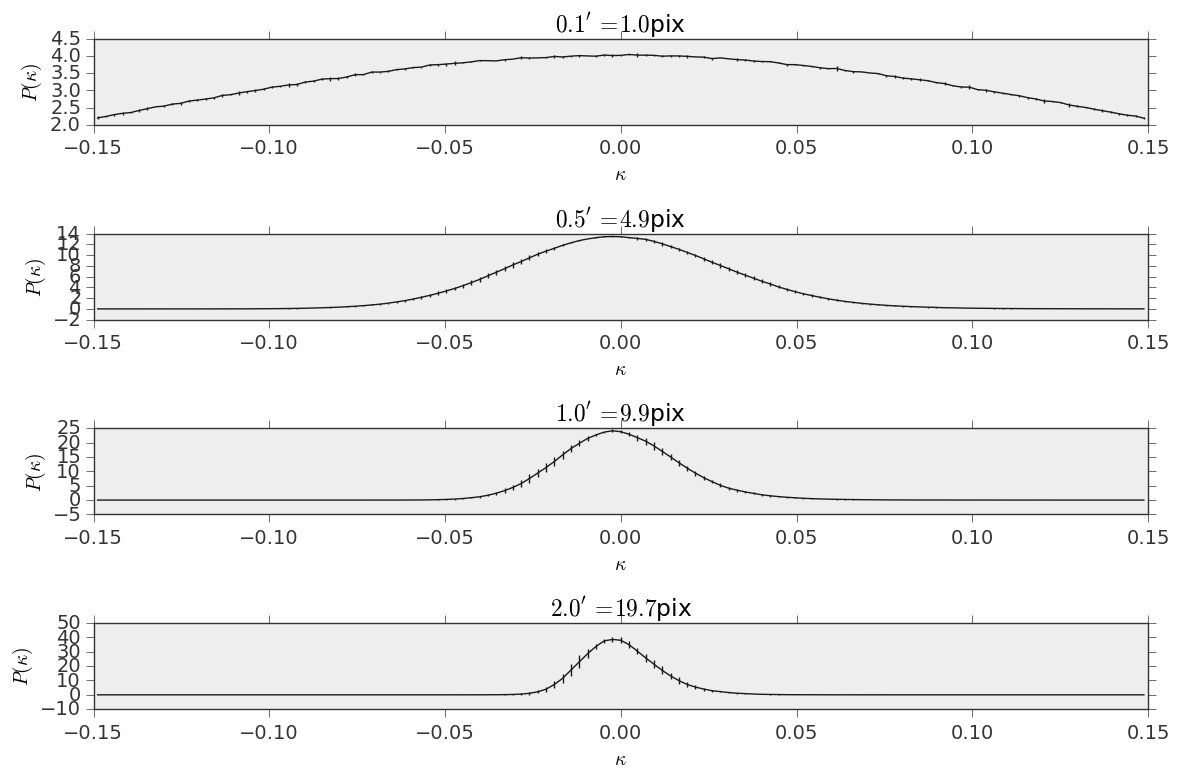
Histograms of convergence maps
import sys

####################################################
#######LensTools functionality######################
####################################################

from lenstools import ConvergenceMap,Ensemble,GaussianNoiseGenerator
from lenstools.legacy.index import PDF,Indexer
from lenstools.simulations.igs1 import IGS1

#####################################################

import numpy as np
import astropy.units as u
import matplotlib.pyplot as plt

from lenstools.utils.mpi import MPIWhirlPool

import logging
import argparse

#########################################################################################
#########This function gets called on every map image and computes the histograms########
#########################################################################################

def compute_histograms(map_id,simulation_set,smoothing_scales,index,generator,bin_edges):

        assert len(index.descriptor_list) == len(smoothing_scales)

        z = 1.0

        #Get map name to analyze
        map_name = simulation_set.getNames(z=z,realizations=[map_id])[0]

        #Load the convergence map
        convergence_map = ConvergenceMap.load(map_name)

        #Generate the shape noise map
        noise_map = generator.getShapeNoise(z=z,ngal=15.0*u.arcmin**-2,seed=map_id)

        #Add the noise
        convergence_map += noise_map

        #Measure the features
        hist_output = np.zeros(index.size)
        for n,descriptor in enumerate(index.descriptor_list):

                logging.debug("Processing {0} x {1}".format(map_name,smoothing_scales[n]))

                smoothed_map = convergence_map.smooth(smoothing_scales[n])
                v,hist_output[descriptor.first:descriptor.last] = smoothed_map.pdf(bin_edges)

        #Return the histograms in array format
        return hist_output

############################################################
########################Main loop###########################
############################################################

if __name__=="__main__":

        #Initialize MPI pool
        try:
                pool = MPIWhirlPool()
        except ValueError:
                pool = None

        #Parse command line arguments
        parser = argparse.ArgumentParser()
        parser.add_argument("-v","--verbose",action="store_true",default=False,dest="verbose",help="Display debug info")
        parser.add_argument("-p","--path",action="store",dest="path",default="/Users/andreapetri/Documents/Columbia/spurious_shear/convergence_maps",help="Root path of IGS1 simulations")
        parser.add_argument("-n","--num_realizations",dest="num_realizations",action="store",type=int,default=3,help="How many realizations to process")

        cmd_args = parser.parse_args()

        #Set logging level
        if cmd_args.verbose:
                logging.basicConfig(level=logging.DEBUG)
        else:
                logging.basicConfig(level=logging.INFO)

        if (pool is not None) and not(pool.is_master()):

                pool.wait()
                sys.exit(0)

        #Root path of IGS1 maps
        root_path = cmd_args.path
        num_realizations = cmd_args.num_realizations

        #Smoothing scales in arcmin
        smoothing_scales = [ theta*u.arcmin for theta in [0.1,0.5,1.0,2.0] ]
        bin_edges = np.ogrid[-0.15:0.15:128j]
        bin_midpoints = 0.5*(bin_edges[1:] + bin_edges[:-1])

        #Create smoothing scale index for the histogram
        idx = Indexer.stack([PDF(bin_edges) for scale in smoothing_scales])

        #Create IGS1 simulation set object to look for the right simulations
        simulation_set = IGS1(root_path=root_path)

        #Look at a sample map
        sample_map = ConvergenceMap.load(simulation_set.getNames(z=1.0,realizations=[1])[0])

        #Initialize Gaussian shape noise generator
        generator = GaussianNoiseGenerator.forMap(sample_map)

        #Measure the histograms and load the data in the ensemble
        map_ensemble = Ensemble.compute(range(1,num_realizations+1),callback_loader=compute_histograms,pool=pool,simulation_set=simulation_set,smoothing_scales=smoothing_scales,index=idx,generator=generator,bin_edges=bin_edges)

        if pool is not None:
                pool.close()

        ##########################################################################################################################################
        ###############################Ensemble data available at this point for covariance, PCA, etc...##########################################
        ##########################################################################################################################################

        #Plot results to check
        fig,ax = plt.subplots(len(smoothing_scales),1)
        for i in range(len(smoothing_scales)):

                mean = map_ensemble.mean(0).values[idx[i].first:idx[i].last]
                error = np.sqrt(map_ensemble.cov().values.diagonal()[idx[i].first:idx[i].last])

                ax[i].errorbar(bin_midpoints,mean,yerr=error)

                ax[i].set_xlabel(r"$\kappa$")
                ax[i].set_ylabel(r"$P(\kappa)$")
                ax[i].set_title(r"${0:.1f}^\prime={1:.1f}$pix".format(smoothing_scales[i].value,(smoothing_scales[i] * sample_map.data.shape[0]/(sample_map.side_angle)).decompose().value))


        fig.tight_layout()
        fig.savefig("histograms.png")
You run this typing:
python histograms.py -p <path_to_your_simulations> -n <number_of_realizations>
Or, if you have a MPI installation and want to run on multiple processors:
mpiexec -n <number_of_processors> python histograms.py -p <path_to_your_simulations> -n <number_of_realizations>
This is how the result looks like