Decompose a shear map into E and B modes
from lenstools import ShearMap
from lenstools.utils.defaults import load_fits_default_convergence,load_fits_default_shear
import numpy as np
import matplotlib.pyplot as plt
from astropy.io import fits
from astropy.units import deg
def two_file_loader(filename1,filename2):
shear_file_1 = fits.open(filename1)
angle = shear_file_1[0].header["ANGLE"]
gamma = shear_file_1[0].data.astype(np.float)
shear_file_1.close()
shear_file_2 = fits.open(filename2)
assert shear_file_2[0].header["ANGLE"] == angle
gamma = np.array((gamma,shear_file_2[0].data.astype(np.float)))
shear_file_2.close()
return angle*deg,gamma
test_map = ShearMap.load("Data/shear1.fit",filename2="Data/shear2.fit",format=two_file_loader)
l_edges = np.arange(200.0,50000.0,200.0)
l,EE,BB,EB = test_map.decompose(l_edges,keep_fourier=True)
assert l.shape == EE.shape == BB.shape == EB.shape
fig,ax = plt.subplots()
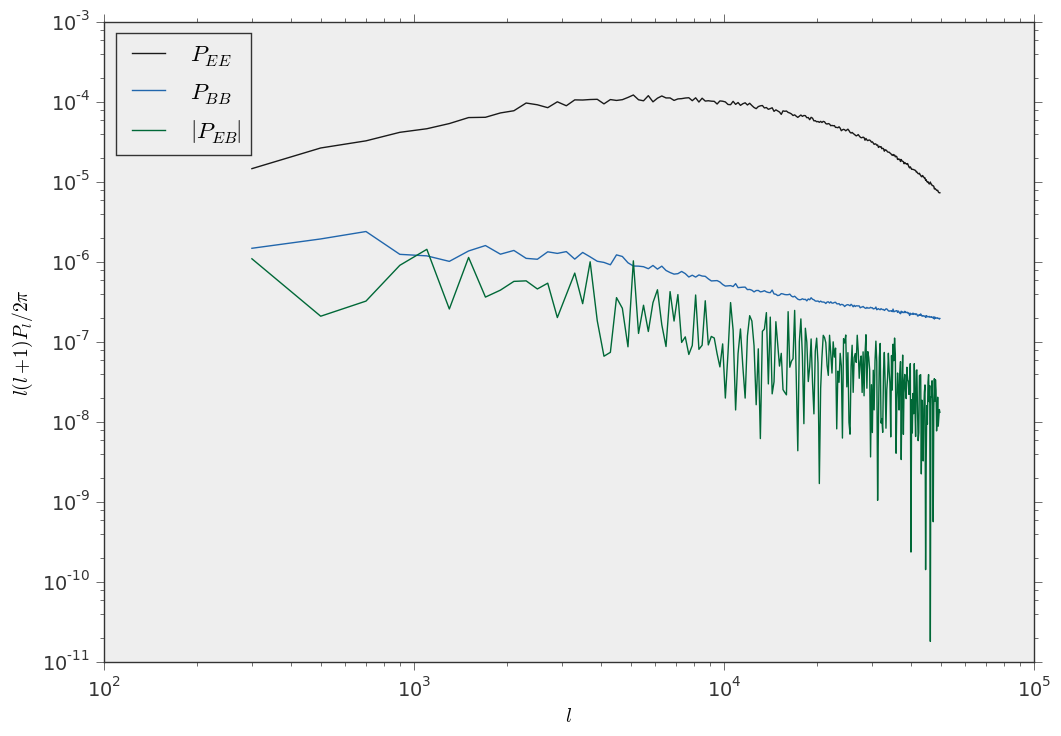
ax.plot(l,l*(l+1)*EE/(2.0*np.pi),label=r"$P_{EE}$")
ax.plot(l,l*(l+1)*BB/(2.0*np.pi),label=r"$P_{BB}$")
ax.plot(l,l*(l+1)*np.abs(EB)/(2.0*np.pi),label=r"$\vert P_{EB}\vert$")
ax.set_xscale("log")
ax.set_yscale("log")
ax.set_xlabel(r"$l$")
ax.set_ylabel(r"$l(l+1)P_l/2\pi$")
ax.legend(loc="upper left")
plt.savefig("EB.png")
plt.clf()
fig,ax = plt.subplots()
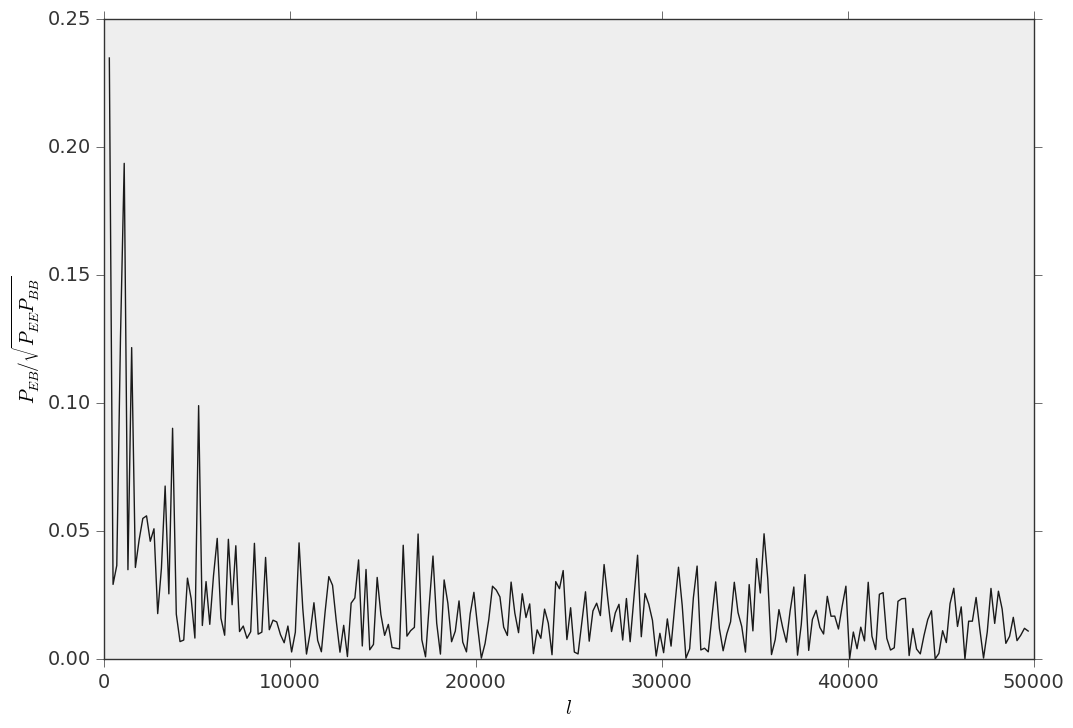
ax.plot(l,np.abs(EB)/np.sqrt(EE*BB))
ax.set_xlabel(r"$l$")
ax.set_ylabel(r"$P_{EB}/\sqrt{P_{EE}P_{BB}}$")
plt.savefig("EB_corr.png")
These are the \(P_{EE}(l),P_{BB}(l),P_{EB}(l)\) power spectra
and this is their cross correlation